Much research links learning to storytelling, but that’s never been the model that works for me. I’m prone to abstraction. When it comes to learning, I find it easier to relate to knowledge through concepts rather than narratives.
There’s something remarkable about capturing knowledge, processes, or behaviors in the form of a flowchart. Modeling information into a diagram with decision points forces a distillation that makes the underlying structure clearer. The model—along with all its assumptions—becomes exposed, and for me, that transparency makes it easier to learn.
I often create flowcharts (and hierarchical task analyses) to understand the design problems I’m working on. I’ve also used them to map assumptions and user research activities. So when I see a well-crafted flowchart, I really appreciate it.
Right now, I’m building a custom post type in WordPress. There’s plenty of documentation on templates (which isn’t as “sticky” as a story—but that’s a topic for another day). I’m also leaning on ChatGPT, which I think of as a kind of AI documentation, to streamline the process. My understanding steadily improves as I move between WordPress docs and ChatGPT explanations.
Luckily, I stumbled across the WordPress Template Hierarchy flowchart, and suddenly everything clicked.
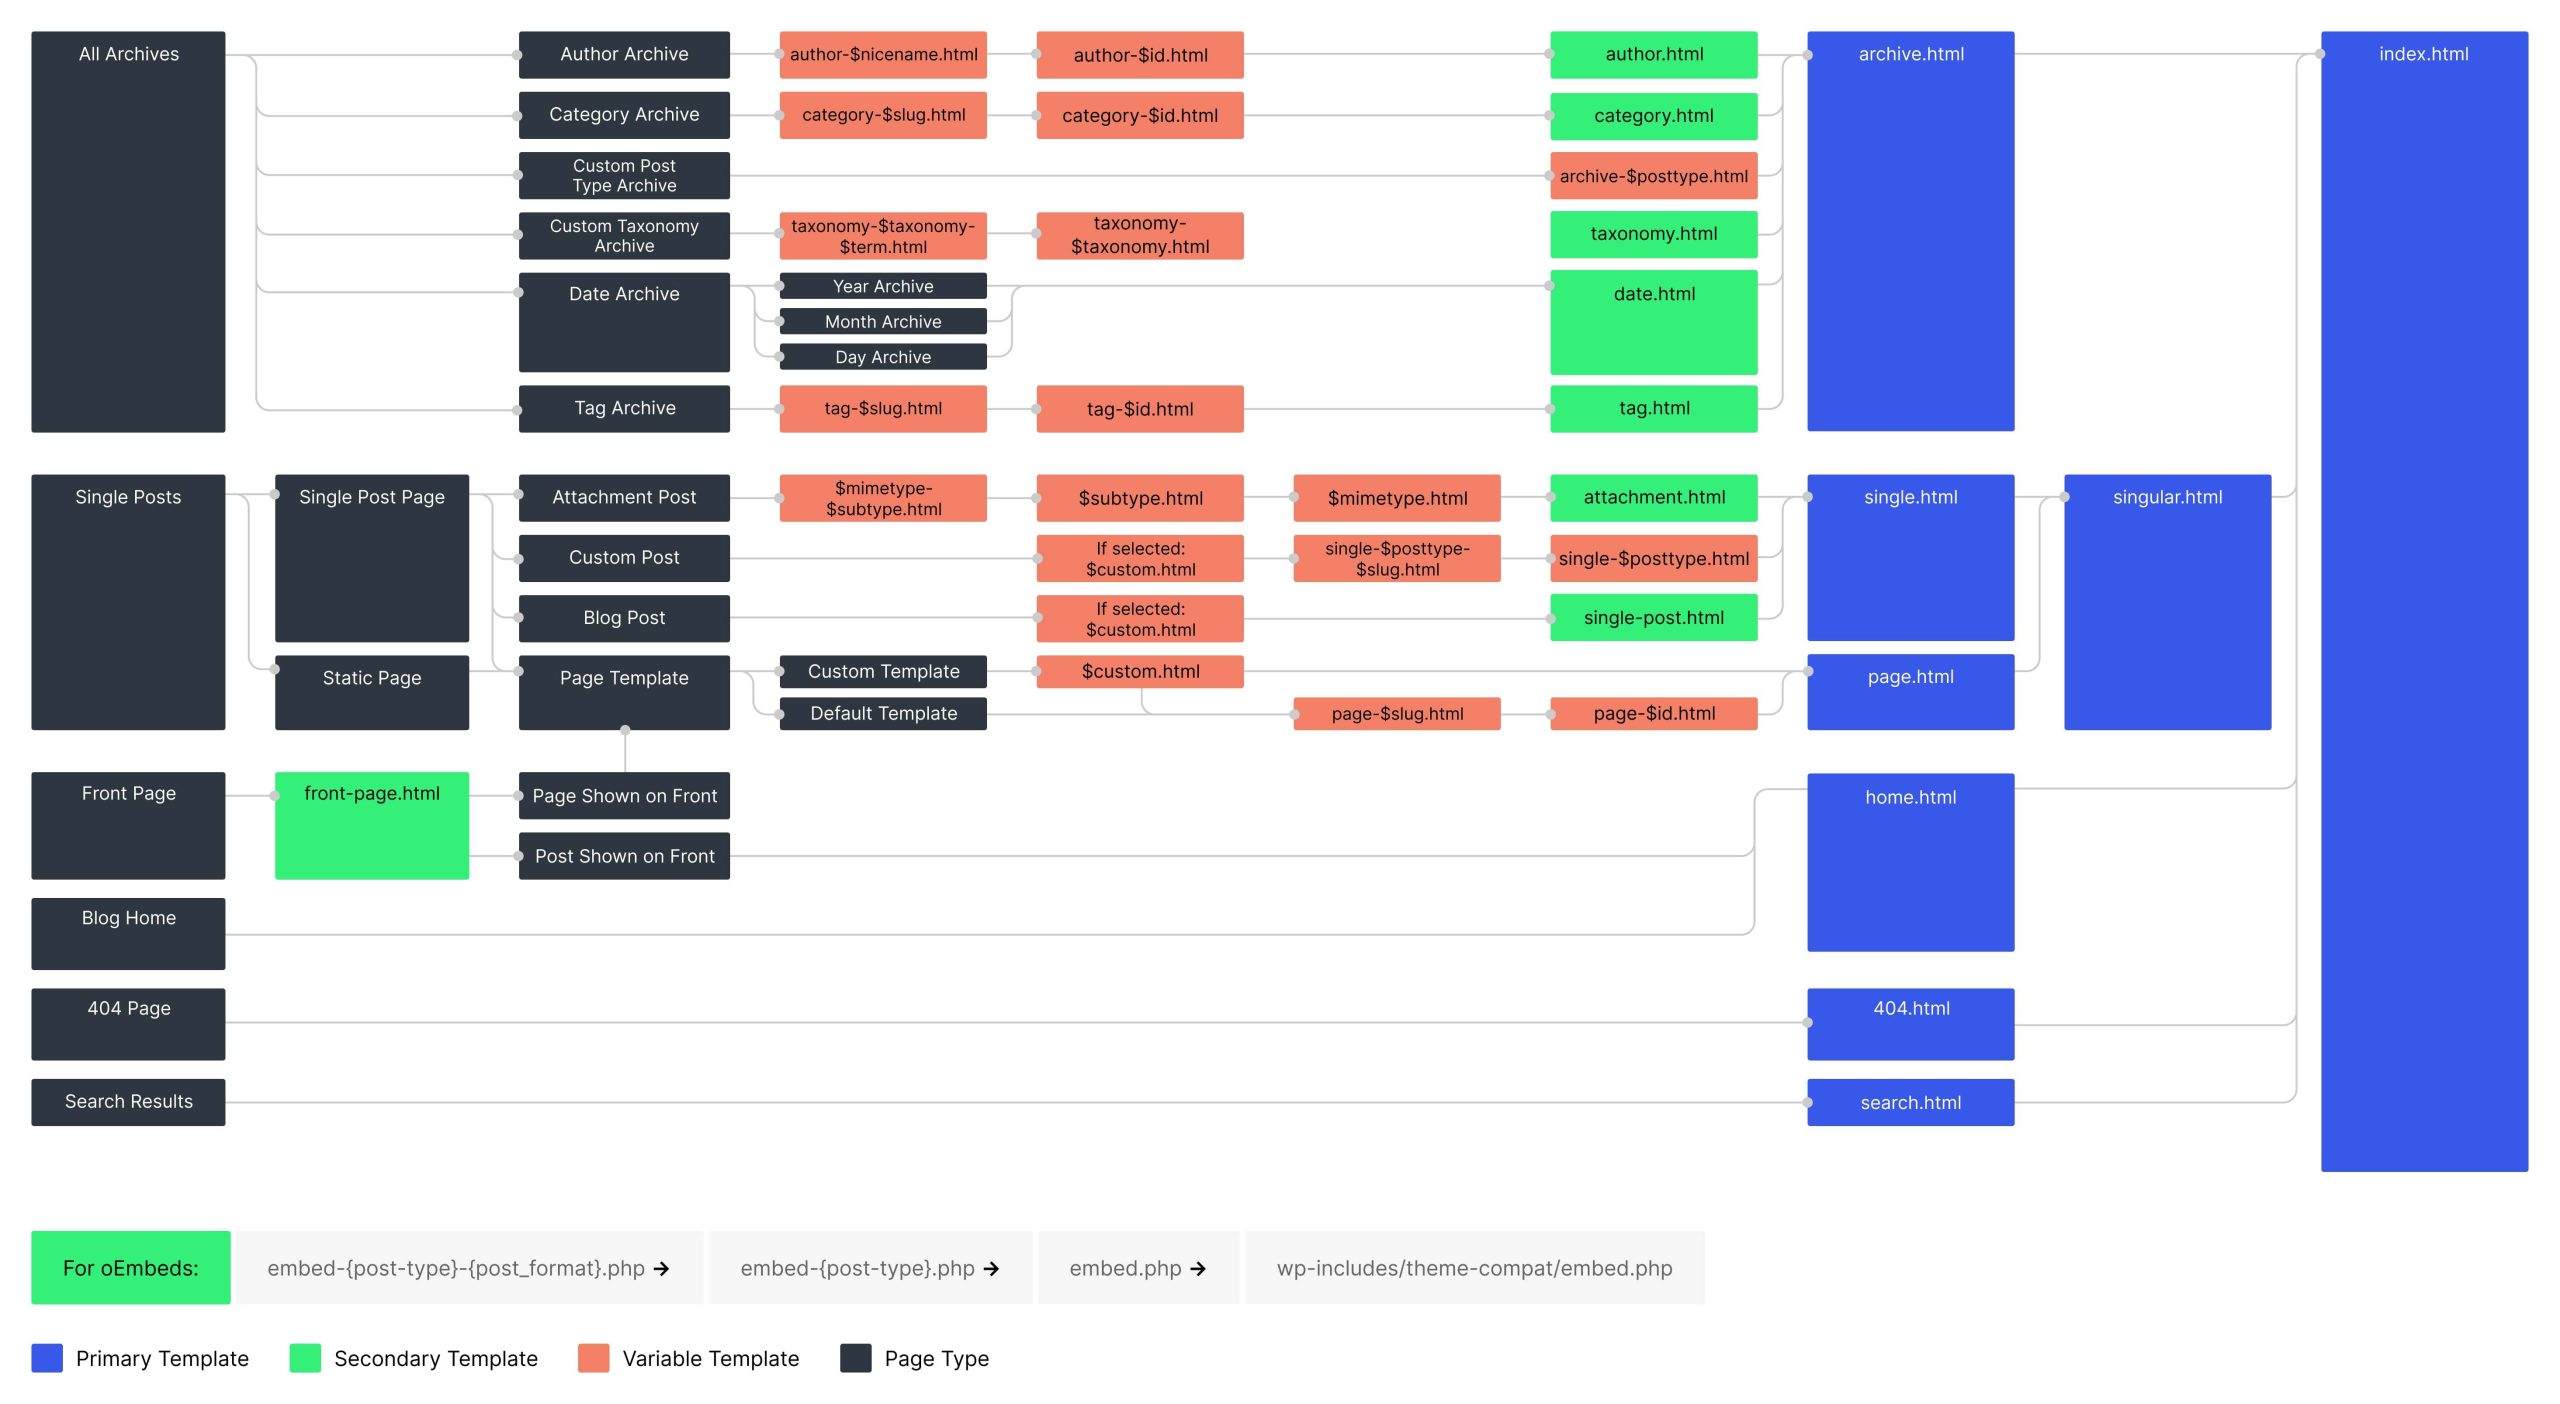
I’m not a fan of the color scheme. The bright palette feels like part of a broader trend where abstraction gets dressed up for visual appeal at the expense of clarity. A muted scheme would have better served its role as a learning tool. Still, it’s a solid flowchart—and a great reminder of why I value them so much.